Background
Research-assistant project, built at the supervisor’s request — the Policy Evidence Knowledge Graph Platform, a monorepo of three interlocking modules that support evidence-grounded question answering over climate-policy scientific literature.
Architecture
The platform is organised as three loosely-coupled services that talk to each other over HTTP:
1. KG backend (Python + Neo4j)
- Ingestion: PDF parsing via MinerU → structured
findings+tables→ Neo4j graph. - Schema separation: tables don’t pollute the prose graph; instead, findings carry
table_refspointers and tables live in their own file store. - KG API exposes:
papers / findings / evidence / tables / semantic / expand / community-summaries / graph-neighborhood / pipeline. - Retrieval features: vector semantic retrieval, schema-completing cross-language retrieval,
CommunitySummarynodes for high-level cross-paper context. - Post-hoc fixes: metadata back-fill, taxonomy correction, table-evidence splitting, review-sheet export — all without re-running the LLM.
2. Constrained Q&A Agent
The agent is a constrained summarizer, not a free chat bot. It can only answer based on KG retrieval results.
- Five-way retrieval routing:
local / semantic / hybrid / expand / community_summaries. - Complex questions auto-decomposed into
sub_queries; multi-driver queries auto-split per driver, then deduplicated and merged. - LLM keyword extraction (gpt-5.4-mini, structured JSON output) running in parallel with regex fallback.
- Hard citation rule: every substantive claim must carry a citation; if evidence is insufficient, the agent says so explicitly rather than hallucinating.
- Each answer comes with programmatic confidence scores (dual-track, see below).
3. Web frontend (React + Vite)
- Streaming Q&A with conversation persistence (
localStorage, last 30 conversations grouped Today / Yesterday / Last 7 Days / Older — Claude-style sidebar). - Knowledge graph visualization via
react-force-graph-2d: node-centric expansion (Paper / Finding / Driver / Outcome) with search, type filter, click-to-expand neighbours, and a “view in graph” jump from any knowledge card or evidence-library entry. - Evidence library: dual view (Paper / Finding) for browsing the underlying corpus.
- Confidence card: overall score + contradiction badge; expanded view shows evidence-side / answer-side sub-scores side by side, Claim category split (📘 Extract / 💭 Extrapolate), and LLM-judge vs. heuristic comparison.
- Feedback loop: 👍 / 👎 on every answer; feedback + full confidence snapshot persists to SQLite (
agent/data/feedback.db) — directly used for offline weight calibration.
Anti-hallucination control
Stacked validation layers ensure full answer traceability:
| Layer | What it checks |
|---|---|
| Citation whitelist | Agent can only cite papers present in the KG. |
| Directional conflict detection | Claims contradicting known KG facts are flagged. |
| Unit normalization | Numeric units normalized before comparison; mismatches surface as conflicts. |
| NLI / LLM-as-judge post-hoc review | Optional fallback validation on assembled answers. |
Dual-track confidence scoring
Two independent scoring tracks, weighted to produce an overall score:
- Evidence side (4 dimensions): source credibility, coverage, recency, redundancy.
- Answer side (5 dimensions): consistency, inference distance, claim density, citation diversity, Extract / Extrapolate balance.
User feedback snapshots drive OLS calibration and feature-weight hot-updates so the scoring function adapts to real usage.
End-to-end pipeline
PDF parsing → finding extraction → snippet-claim alignment
            → Neo4j ingestion → LLM-as-judge auto-evaluation
              (accuracy, traceability, consistency)
The auto-evaluation module scores Agent responses across three dimensions to support iterative system improvement.
Top-level chrome (across all pages)
Present on every route:
- Brand mark — Climate Change Wiki (links back to
/). - Language switcher — toggle between Chinese / English (URL prefix swap, content set switches).
- Corpus count badge — live count of papers currently in the library (e.g. 163 papers).
- Global menu — hamburger menu opening links to Q&A, Knowledge Graph, Evidence Library, Topic browser, Admin (when signed in), Settings.
- Conversation persistence indicator — small dot when an active conversation is being saved to local storage.
Home / Landing page (/)
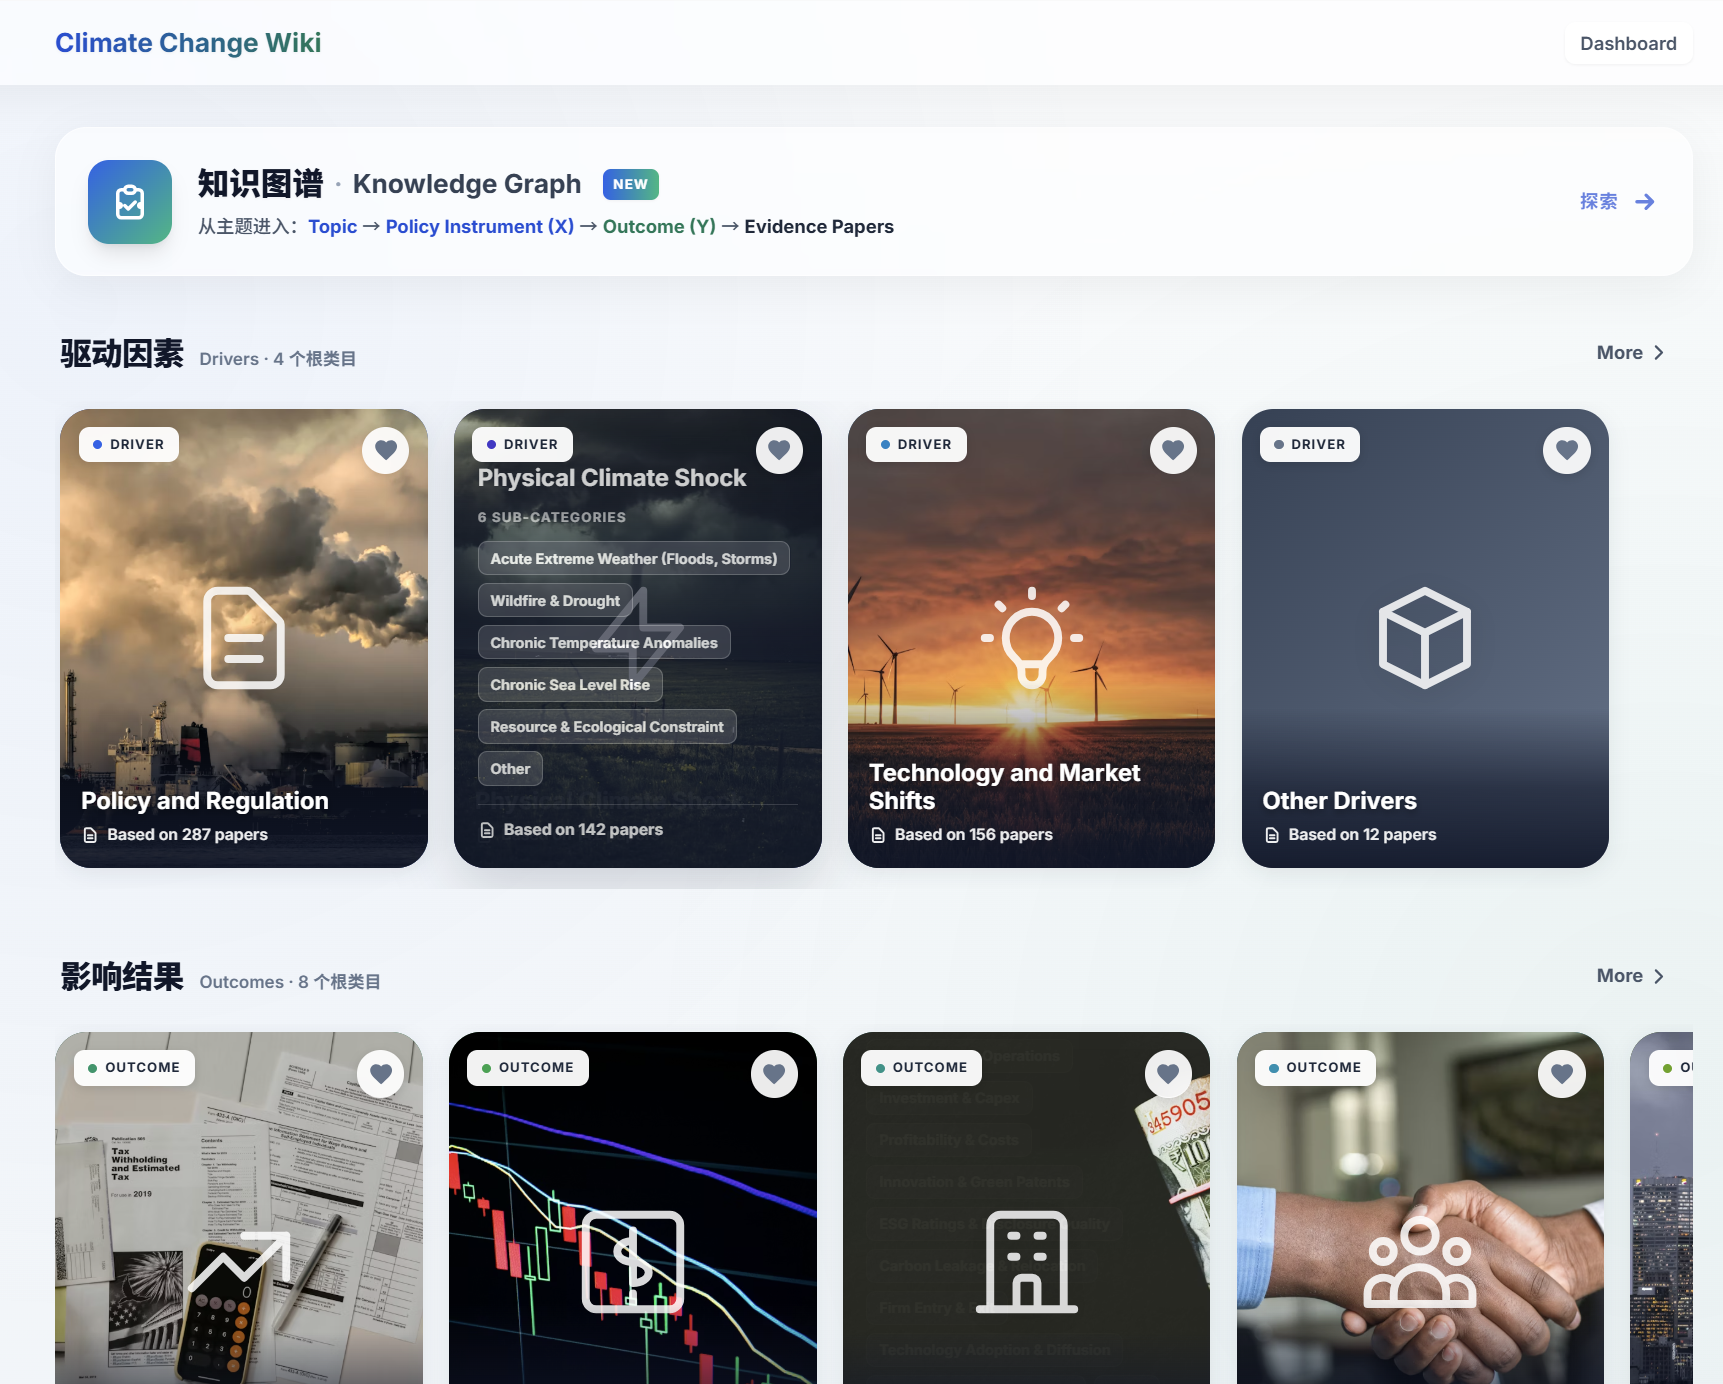
The home view exposes the platform’s core schema: every question begins by choosing a Topic (X) → Policy Instrument → Outcome (Y), which resolves to a set of Evidence Papers. Drivers and Outcomes are the two top-level taxonomies — drivers split into 4 root categories (with Physical Climate Shock further broken into 6 sub-categories: Acute Extreme Weather, Wildfire & Drought, Chronic Temperature Anomalies, Chronic Sea Level Rise, Resource & Ecological Constraint, Other), and outcomes into 8. Each card surfaces the underlying paper count (287 / 142 / 156 / 12 …) so the user can gauge evidence density before drilling in.
Functions on this page:
- Knowledge Graph entry card — explains the X → Y → Evidence Papers traversal and routes to the graph view via the Explore → CTA.
- Drivers row — 4 root cards (Policy and Regulation 287 papers, Physical Climate Shock 142, Technology and Market Shifts 156, Other Drivers 12). The Physical Climate Shock card expands to 6 sub-categories.
- Outcomes row — 8 root cards (Tax & Public Finance, Investment & Capital, Profitability & Costs, Innovation & Patents, ESG Rating & Reputation, Carbon Leakage, Firm Entry / Exit, Technology Adoption & Diffusion).
- Per-card paper counts — small badge per card so users gauge evidence density before drilling in.
- Favourite toggle — heart icon per card; favourited categories pin to a quick-access strip.
- Search / explore bar (top-right) — direct route into Q&A with the search string pre-populated.
- Dashboard link — admin-side dashboard for users with the right role.
Q&A interface (/qa)
Purpose: the agent’s primary surface. User asks a question, the system picks a tier (T1 – T5) based on intent classification, renders the appropriate structured answer.
Functions on this page:
- Left sidebar — conversation history. Last 30 conversations grouped Today / Yesterday / Last 7 Days / Older (Claude-style). Each row shows the first user message as the title.
- New-conversation button at the top of the sidebar.
- Sidebar collapse (← / →) for narrow viewports.
- Main pane — streaming Q&A. Renders the user prompt at the top, then the agent’s tiered answer below; supports SSE streaming so the first card appears before the rest are computed.
- Tier router — auto-routes the prompt to T1 / T2 / T3 / T4 / T5 via intent classification (see the per-tier subsections below).
- Input bar at the bottom — prompt field with a send button; supports multi-line and Shift-Enter for newline.
- Confidence card — always pinned to the answer footer (overall score + dual-track breakdown).
- Per-answer feedback chips — 👍 / 👎 + optional comment.
- Copy / share menu — per-answer share link that recreates the same conversation state.
T1 — Concept retrieval (“What is X? / What kinds of X exist?”)
Coverage: ~10% of incoming queries. Output contract: a knowledge-card page only — the agent’s job is to answer the concept and nothing more, with citations to multiple references.
For concept-style questions (e.g. “what is carbon pricing?”), the agent renders the answer as a structured multi-card page rather than a flat paragraph. The walkthrough below goes through every card on the page in numerical / page-order, with each screenshot embedded at the first card it shows.
C0 — Core definition + canonical citations

The C0 card leads with a one-sentence essence (“carbon pricing turns GHG-emission environmental costs into a visible price signal, making emitters pay per ton — using market mechanisms to drive reductions”), then expands into canonical academic definitions with per-paragraph citation chips. Every claim is anchored to a specific paper in the KG — no free-form prose without provenance. The page renders with a fixed slot order, so the cards below this one always follow in the same sequence (only their content varies per query).
C2 — Global implementation landscape
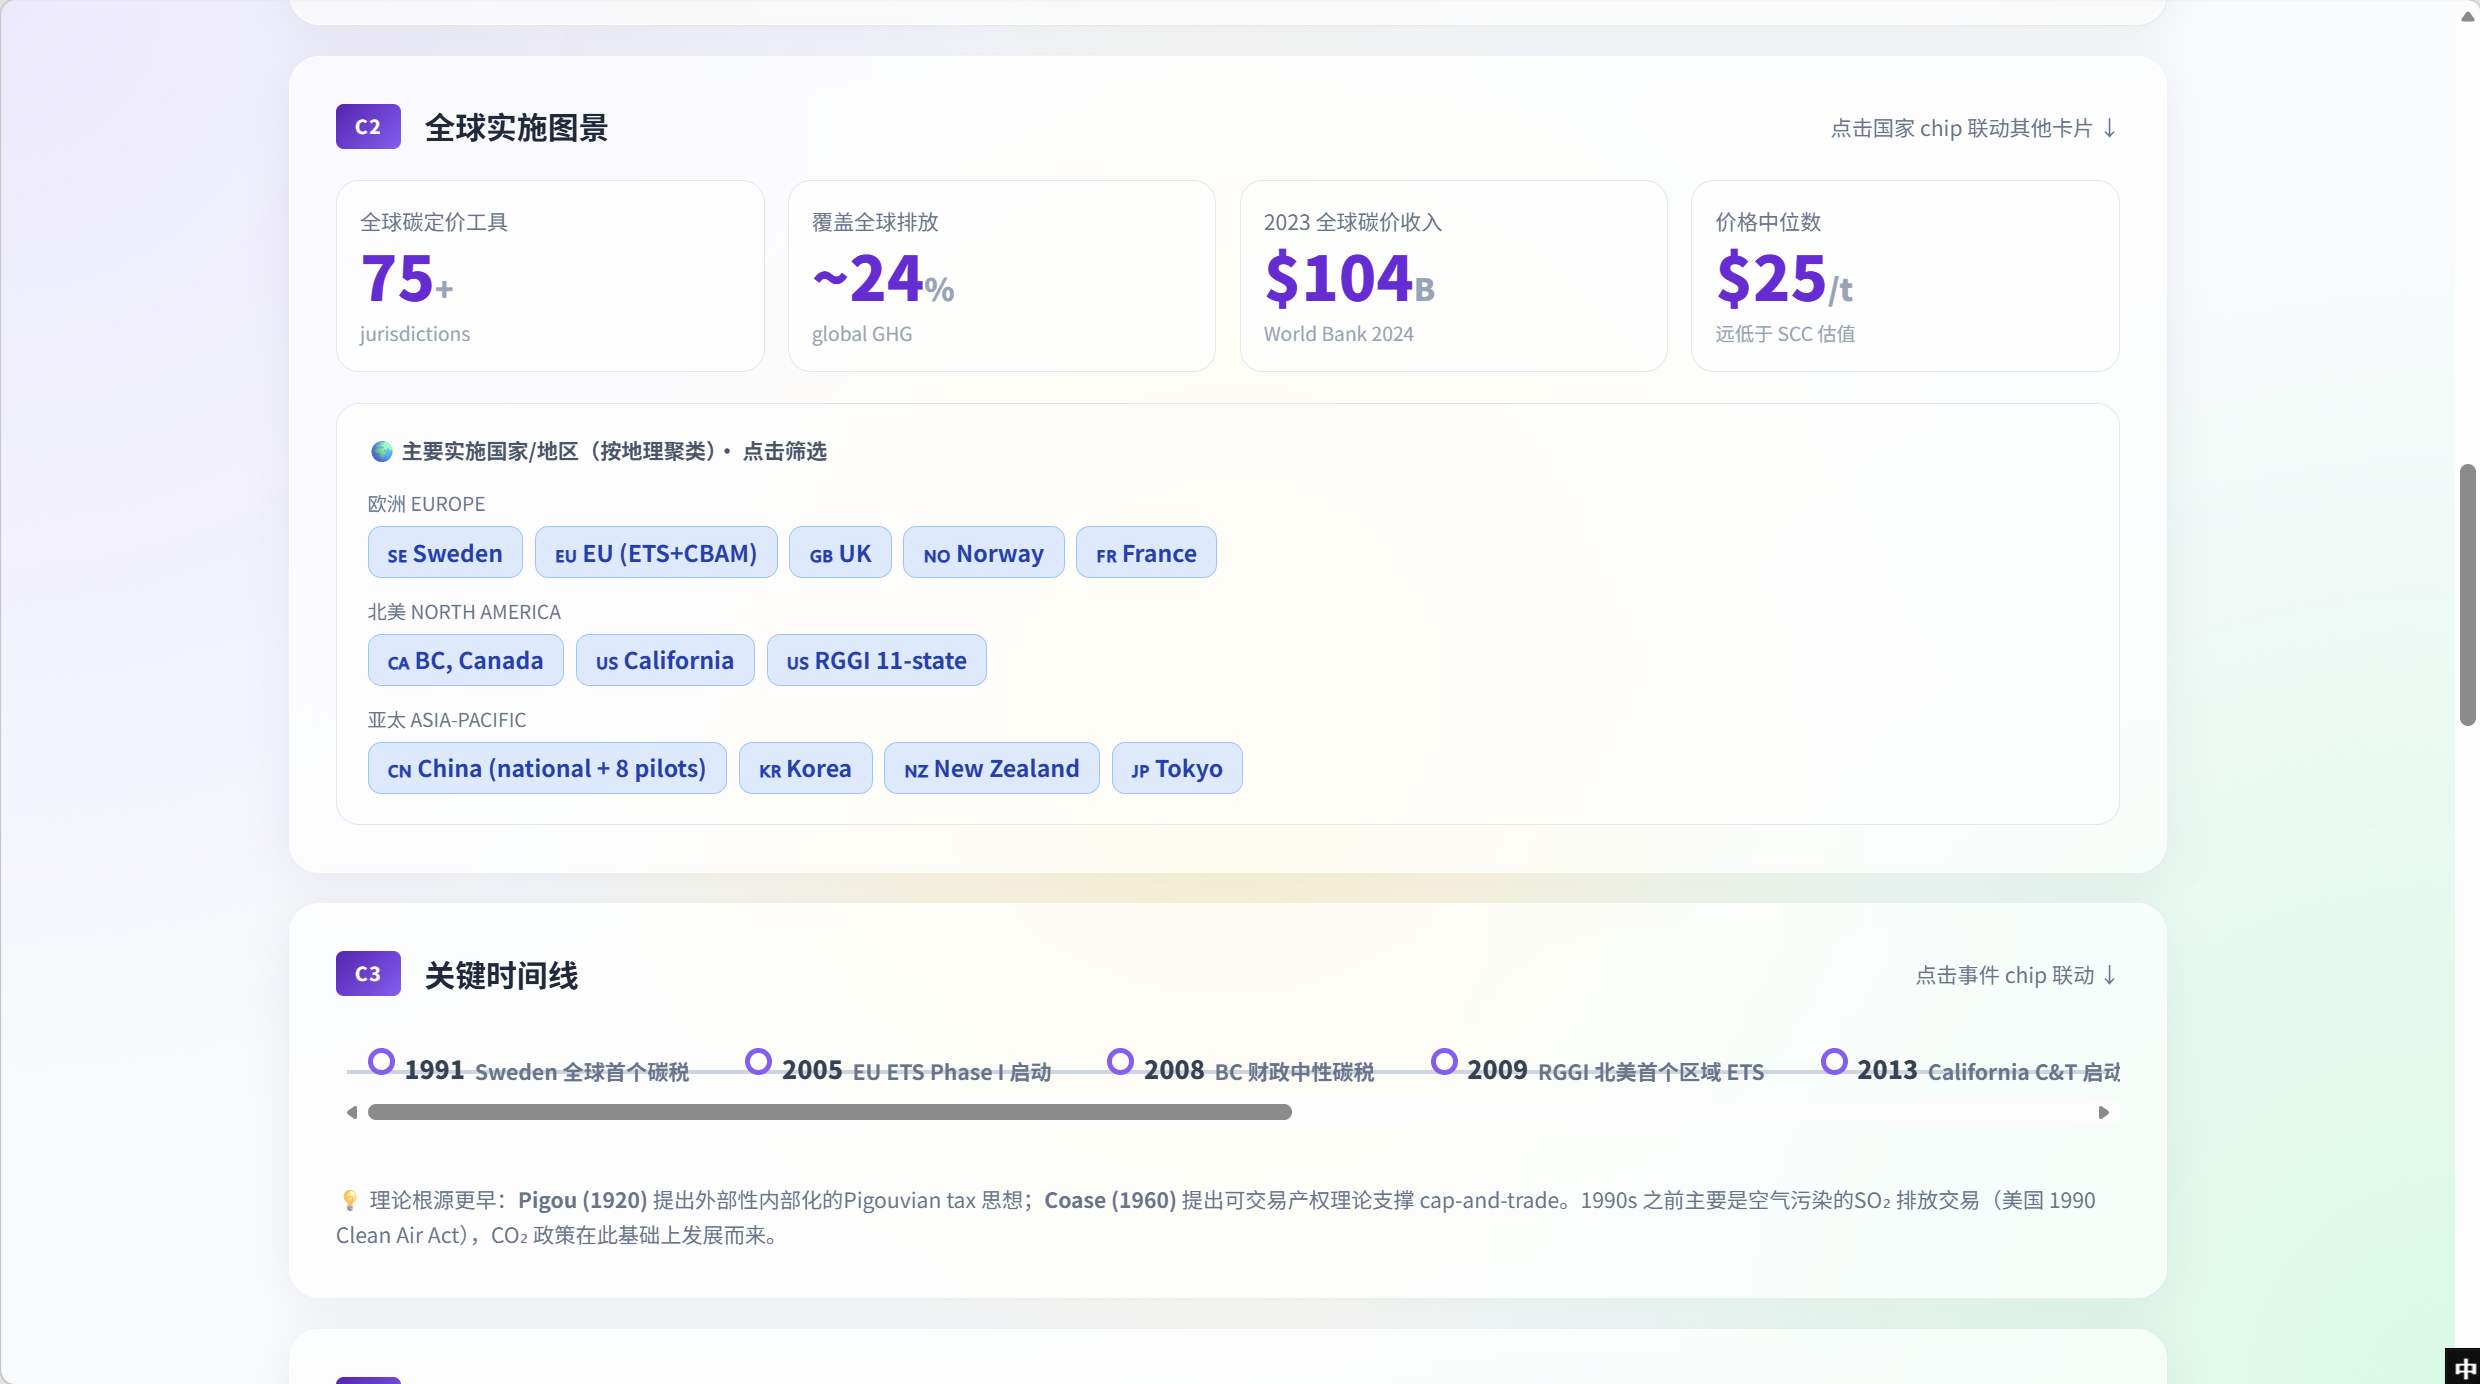
C2 surfaces the empirical scale of the concept — 75+ jurisdictions, ~24% global GHG coverage, $104B 2023 revenue, $25/t median price (well below the social cost of carbon). Below the KPI tiles, jurisdictions are grouped by geographic cluster (Europe / North America / Asia-Pacific) and rendered as clickable chips. Clicking China filters every other card on the page to China-related evidence; clicking again clears the filter.
C3 — Key timeline
Chronological policy milestones rendered as a horizontal time-strip: 1991 Sweden first global carbon tax · 2005 EU ETS Phase I · 2008 BC fiscally-neutral carbon tax · 2009 RGGI · 2013 California C&T and beyond. A footnote names the theoretical roots (Pigou 1920, Coase 1960) and the US 1990 Clean Air Act SO₂ trading as a precursor. Clicking any milestone chip opens a side drawer with the evidence cluster for that era (papers tagged within the milestone’s date window).
C4 — Concept relation graph
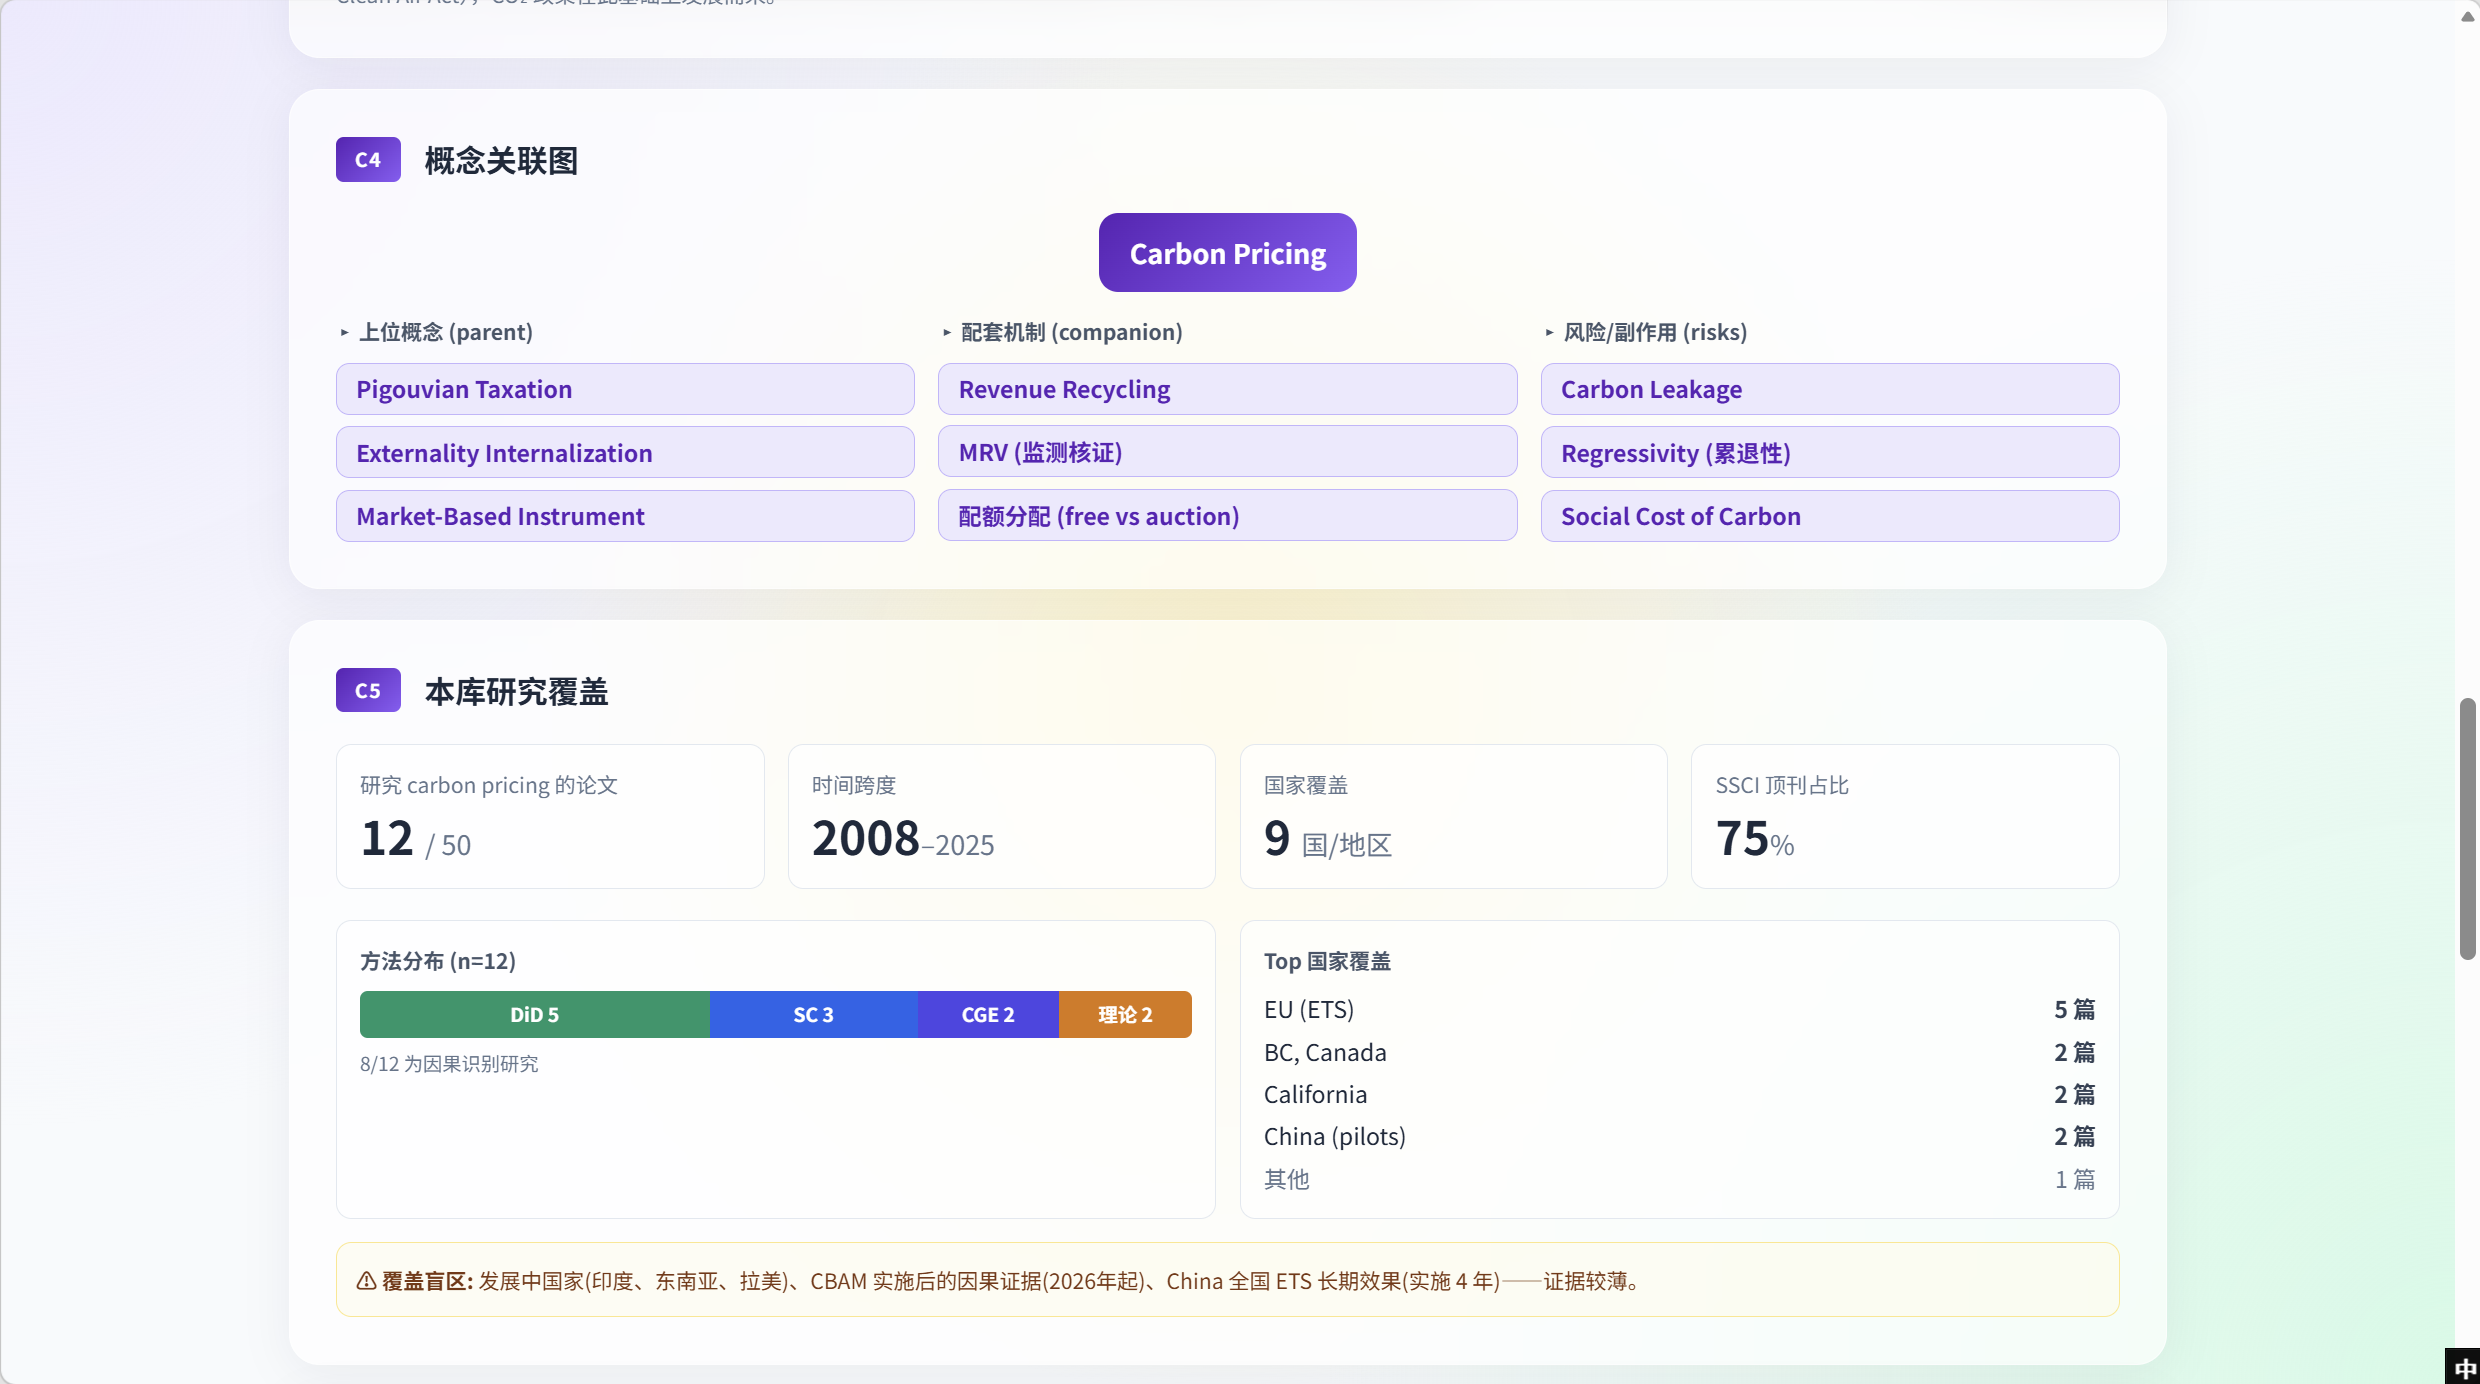
C4 places the concept inside its conceptual neighbourhood — parents (Pigouvian Taxation, Externality Internalization, Market-Based Instrument), companions (Revenue Recycling, MRV, free-vs-auction allocation), risks (Carbon Leakage, Regressivity, Social Cost of Carbon) — drawn directly from the KG’s typed edges. Each node is clickable: clicking Revenue Recycling routes to a fresh T1 query for that companion concept while preserving the parent-concept breadcrumb.
C5 — Library research coverage
The meta-card. It quantifies how well the library itself covers the concept (12 of 50 papers, time span 2008–2025, 9 countries, 75% top-journal share, method distribution DiD 5 / SC 3 / CGE 2 / theory 2 — 8 of 12 are causal-identification studies). A Top country coverage list shows EU (ETS) 5 papers, BC Canada 2, California 2, China (pilots) 2, other 1. A warning band at the bottom explicitly names coverage blind-spots — developing countries (India, SEA, Latin America), post-CBAM causal evidence (from 2026+), long-term effects of China’s national ETS (>4 years). This is the inverse of a hallucination-prone system: it surfaces what it doesn’t know before the user has to ask.
Evidence cards — paper-by-paper
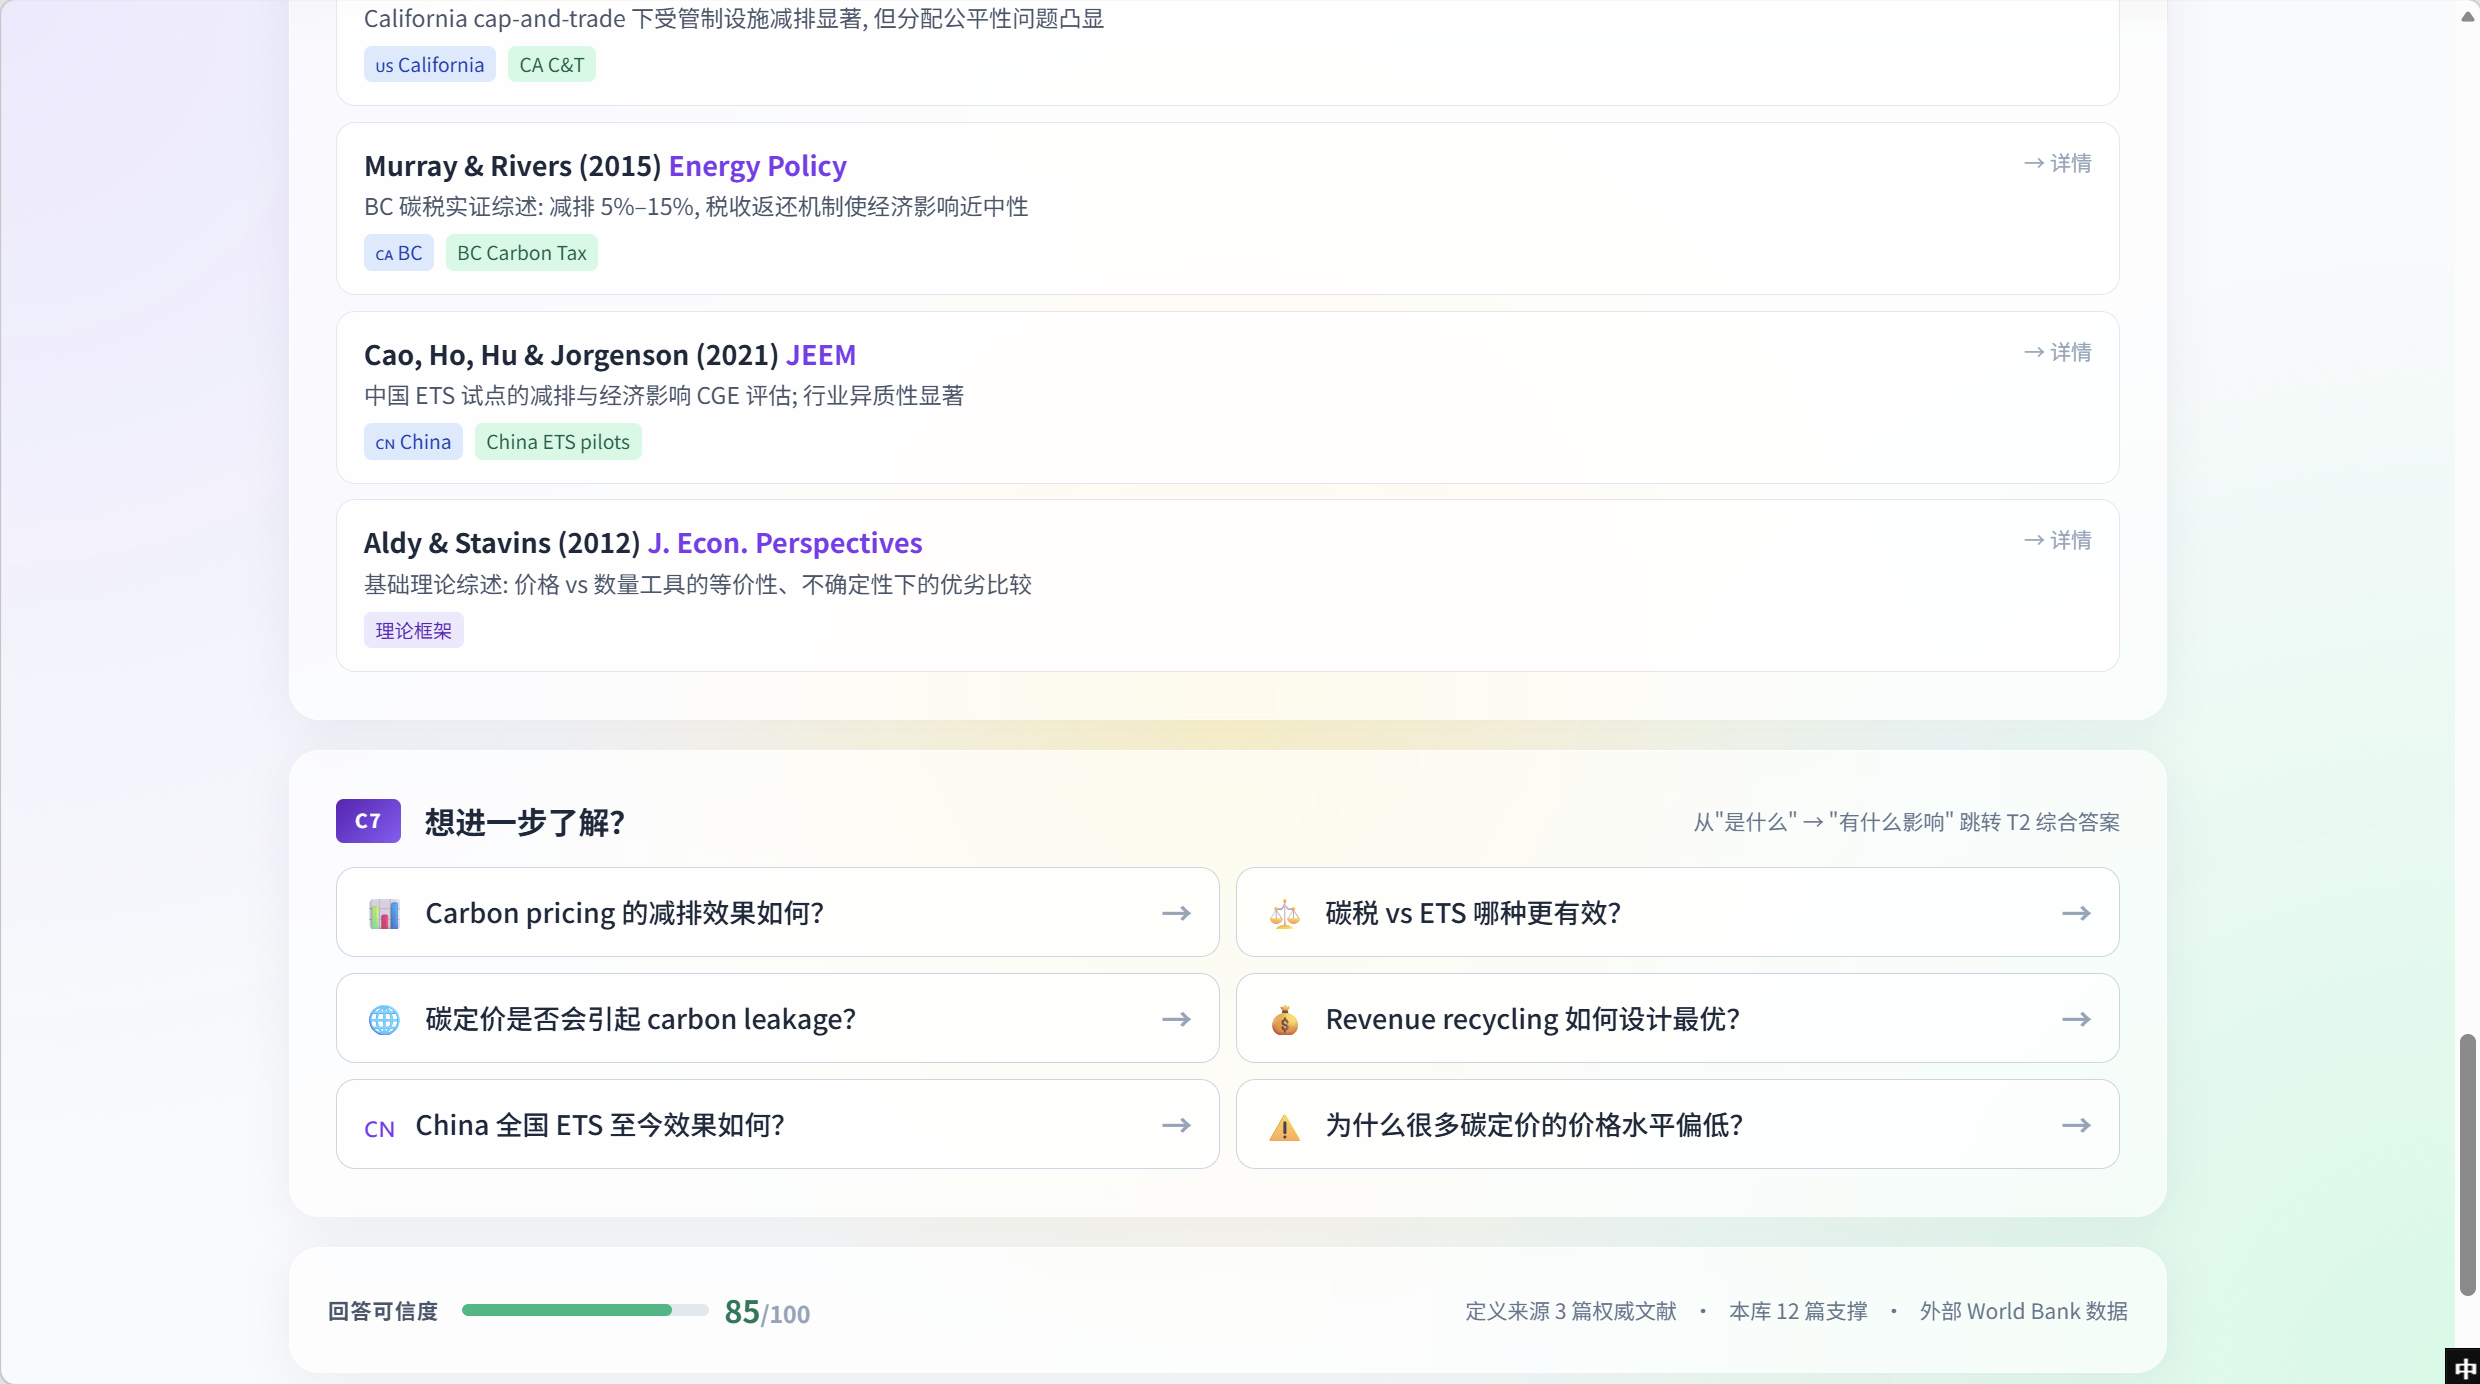
After C5, the page renders paper-by-paper evidence cards — one per relevant in-library paper, each carrying the headline finding, country / tool tags, and a click-through into the full Evidence-Library entry. Examples in the screenshot: California cap-and-trade significantly reduced emissions but raised distributional concerns (CA C&T); Murray & Rivers 2015 (Energy Policy) — BC carbon tax empirical synthesis (5%–15% emission reductions, near-neutral economic impact via revenue recycling); Cao Ho Hu Jorgenson 2021 (JEEM) — China ETS pilot CGE assessment; Aldy & Stavins 2012 (J. Econ. Perspectives) — foundational theory review.
C7 — Follow-up question chips
C7 is the want-to-know-more card — the system’s understanding of what kinds of questions naturally come next. In the example: “how effective is carbon pricing at emission reduction?”, “carbon tax vs ETS — which works better?”, “does carbon pricing cause carbon leakage?”, “how to design revenue recycling optimally?”, “how well has China’s national ETS performed so far?”, “why are carbon prices generally low?”. Each chip is typed — the prefix routes to the appropriate answer-tier (mostly T2 here, since C7’s job in T1 is to bridge from definition → impact / comparison).
Confidence bar (page footer)
At the very bottom: an Answer Confidence bar at 85/100, with a provenance breakdown — 3 authoritative external definitions · 12 internal-library citations · external World Bank data. The bar is always pinned at the answer footer (across T1/T2/T3); how that 85 decomposes is described under T1 confidence breakdown below.
T1 routing — when the agent picks concept-card mode
- Intent classifier runs first over the query (gpt-5.4-mini, structured-output JSON): bucket →
definition / impact / comparison / status-quo / policy / how-to / contested. Only thedefinitionbucket routes to T1. - Patterns that route to T1: “what is X?”, “define X”, “X — definition?”, bare-term queries (“carbon pricing”).
- Ambiguous queries (single ambiguous term with no verb) trigger a disambiguation pre-flow: the agent renders a small picker card with the candidate senses (e.g. carbon tax vs ETS vs cap-and-trade under “carbon pricing”) and asks the user to pick.
- Strict citation-only mode: C0 won’t fire unless ≥ 2 authoritative definitions exist in the KG. If the corpus lacks them, T1 degrades to a single paragraph saying “the library does not contain a canonical definition for X; here is the closest authoritative description we have” — never a hallucinated definition.
Interactive behaviour (not visible in static screenshots)
- C2 country chips are bidirectional filters — clicking China filters every other card on the page to China-related evidence; clicking again clears.
- C3 timeline chips open a side drawer with the evidence subset for that era (papers tagged within the milestone’s date window).
- C4 graph nodes are clickable — clicking Revenue Recycling routes to a fresh T1 query for that companion concept, preserving the parent-concept breadcrumb.
- Citation chips anywhere on the page show the cited snippet on hover (not just the paper title), with a click-through to the full finding in the Evidence Library.
- C7 follow-up chips are typed: each prefix routes to a specific answer-type —
T2(impact),T3(comparison),T4(mechanism),T5(policy implication).
T1 confidence breakdown
The 85/100 in this example decomposes into the dual-track scoring described earlier:
- Evidence side (weighted 40%) — source credibility 95, coverage 88, recency 82, redundancy 92. The slight recency drop reflects that the strongest canonical citations are from 2012 and 2017.
- Answer side (weighted 60%) — consistency 90, inference distance 78 (low — most claims are directly extracted), claim density 85, citation diversity 80 (mostly OECD-anchored — flagged as a coverage caveat), Extract / Extrapolate balance 75 (mostly extract — score reflects an “explanatory but conservative” tone).
- A
caveatbadge appears on the confidence card whenever any answer-side dimension drops below 70.
T2 — Synthesis questions (impact / comparison)
Coverage: ~40% of incoming queries — by far the largest bucket. Anything of the form “does X affect Y?”, “which X is better?”, “how do X+Y stack?”, “how is X going in China?”. Retrieval is two-layer:
- Layer 1 — synthesis-literature corpus. First pass searches a curated Zotero-backed pool of review / meta-analysis papers for the headline answer (the “what does the consensus say” layer).
- Layer 2 — per-paper corpus. Second pass searches the full per-paper library for the supporting specific findings (the “what does each underlying study say” layer).
Both layers are then integrated into a single structured answer. The walkthrough below goes through every component of that answer in page order, with each screenshot at the first component it shows.
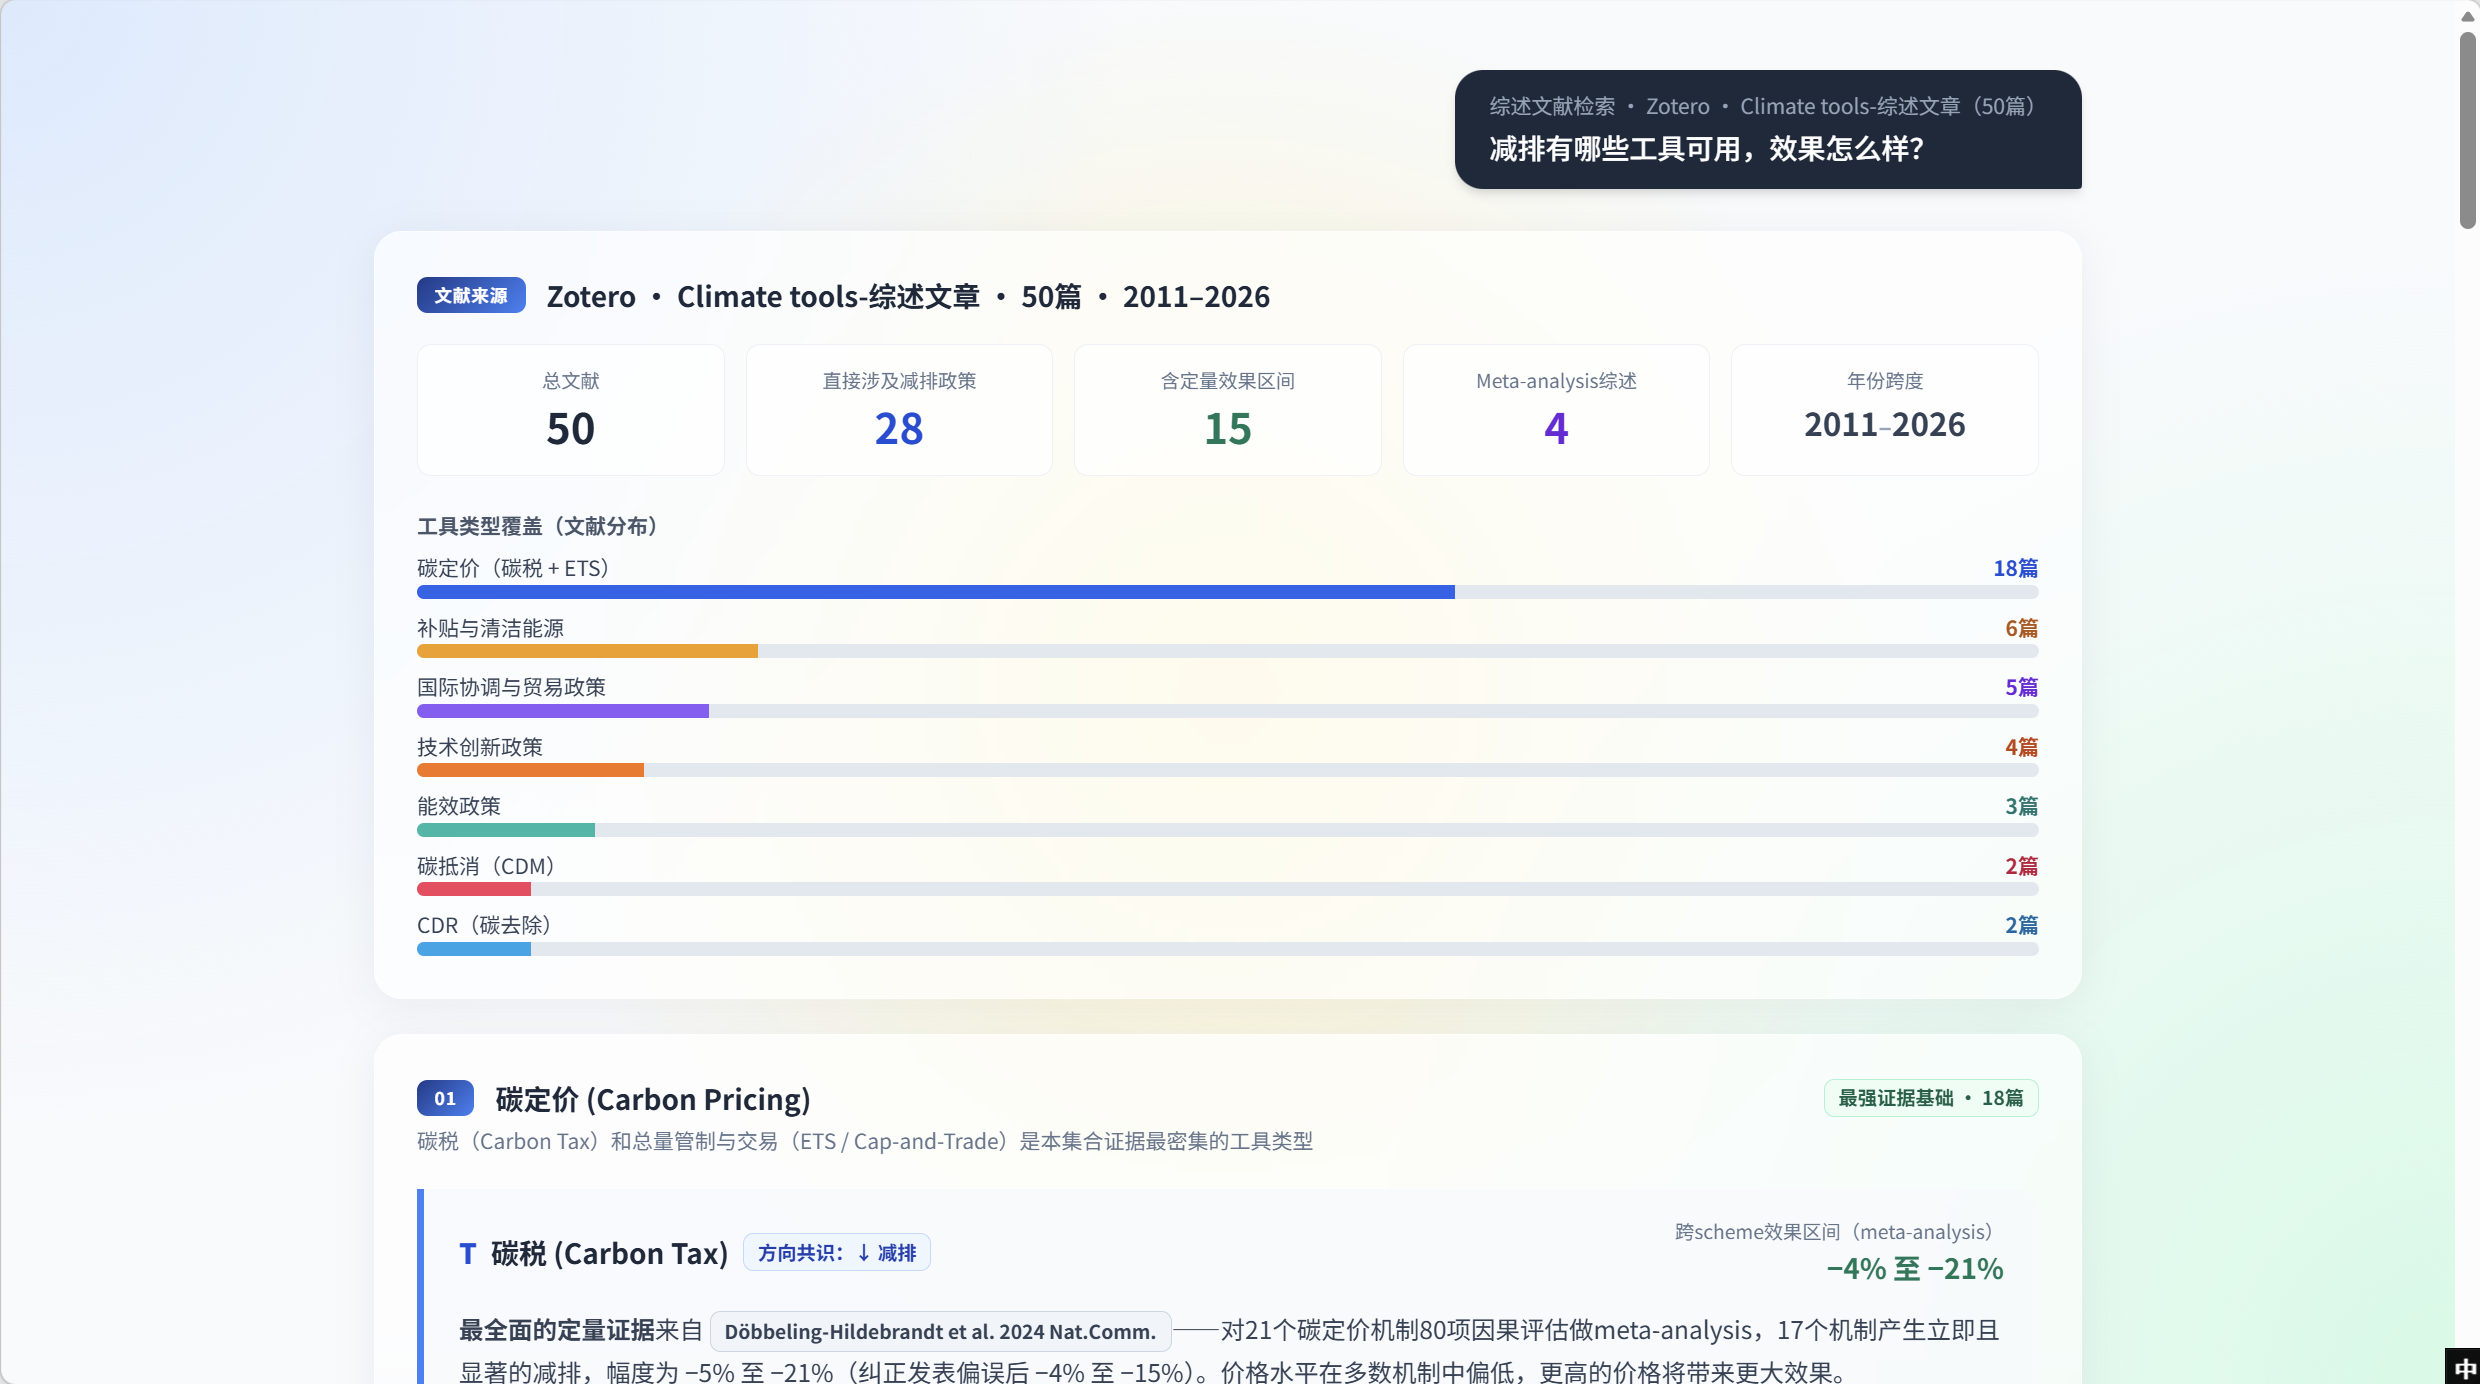
Source-quality dashboard (top of the page)
T2 answers lead with a source-quality dashboard — not just what’s the answer, but what’s the evidence base. The page header reads Literature-Review Retrieval · Zotero · Climate-tools synthesis articles (50 papers) — explicitly naming the corpus this answer is drawn from. Five KPI tiles below it: Total 50 · directly on mitigation policy 28 · with quantitative effect ranges 15 · meta-analyses 4 · year span 2011–2026. The user knows the size and shape of the evidence base before any claim is made.
Tool-type coverage chart
Directly under the dashboard (same screenshot), a horizontal bar chart breaks down the 50 papers by tool category — carbon pricing dominates (18 papers), then subsidies & clean energy (6), international coordination & trade (5), tech innovation (4), energy efficiency (3), carbon offsets / CDM (2), CDR (2). The visual ordering makes evidence density per tool obvious at a glance, and tells the user up-front which tool sections below will be evidence-rich vs thin.
Section 01 — Carbon Pricing
The first per-tool section opens below the coverage chart. 01 — Carbon Pricing gets the strongest-evidence-base banner (18 papers). Its top row is Carbon Tax — direction consensus ↓ reduction, with a meta-analysis effect range of −4% to −21%. The primary citation chip is Döbbeling-Hildebrandt et al. 2024 Nat.Comm., whose one-line abstract explains the meta-analysis covered 80 effect evaluations across 21 carbon-pricing mechanisms — 17 of which produced immediate, significant reductions of −5% to −21% (publication-bias-corrected −4% to −15%); price levels are mostly low across mechanisms, higher prices yield larger effects.
Sections 02 – 07 (other tool categories)
The full T2 answer continues with parallel sections for every tool category that has ≥ 2 papers in the corpus. Each section opens with a strongest-single-citation banner, lists 2–4 supporting findings, and ends with an internal sub-table for any sub-tools the category contains (e.g. carbon pricing splits into carbon-tax and ETS rows; subsidies split by technology).
- 02 — Subsidies & clean energy. Production tax credits, investment tax credits, EV subsidies, FIT mechanisms. Strongest citation: Hahn 2025; quantitative effect bands span MVPF and abatement-cost dimensions.
- 03 — International coordination & trade policy. CBAM, climate clubs, import tariffs, sectoral agreements.
- 04 — Technology-innovation policy. R&D subsidies, public procurement, demonstration programs.
- 05 — Energy-efficiency policy. Standards, labelling, retrofit programs — with explicit caveat that engineering forecasts tend to over-estimate.
- 06 — Carbon offsets / CDM. Rendered with a red warning border because the corpus consensus is negative (additionality failure).
- 07 — CDR (Carbon dioxide removal). Treated as a complementary tool — header acknowledges thin evidence and high uncertainty.
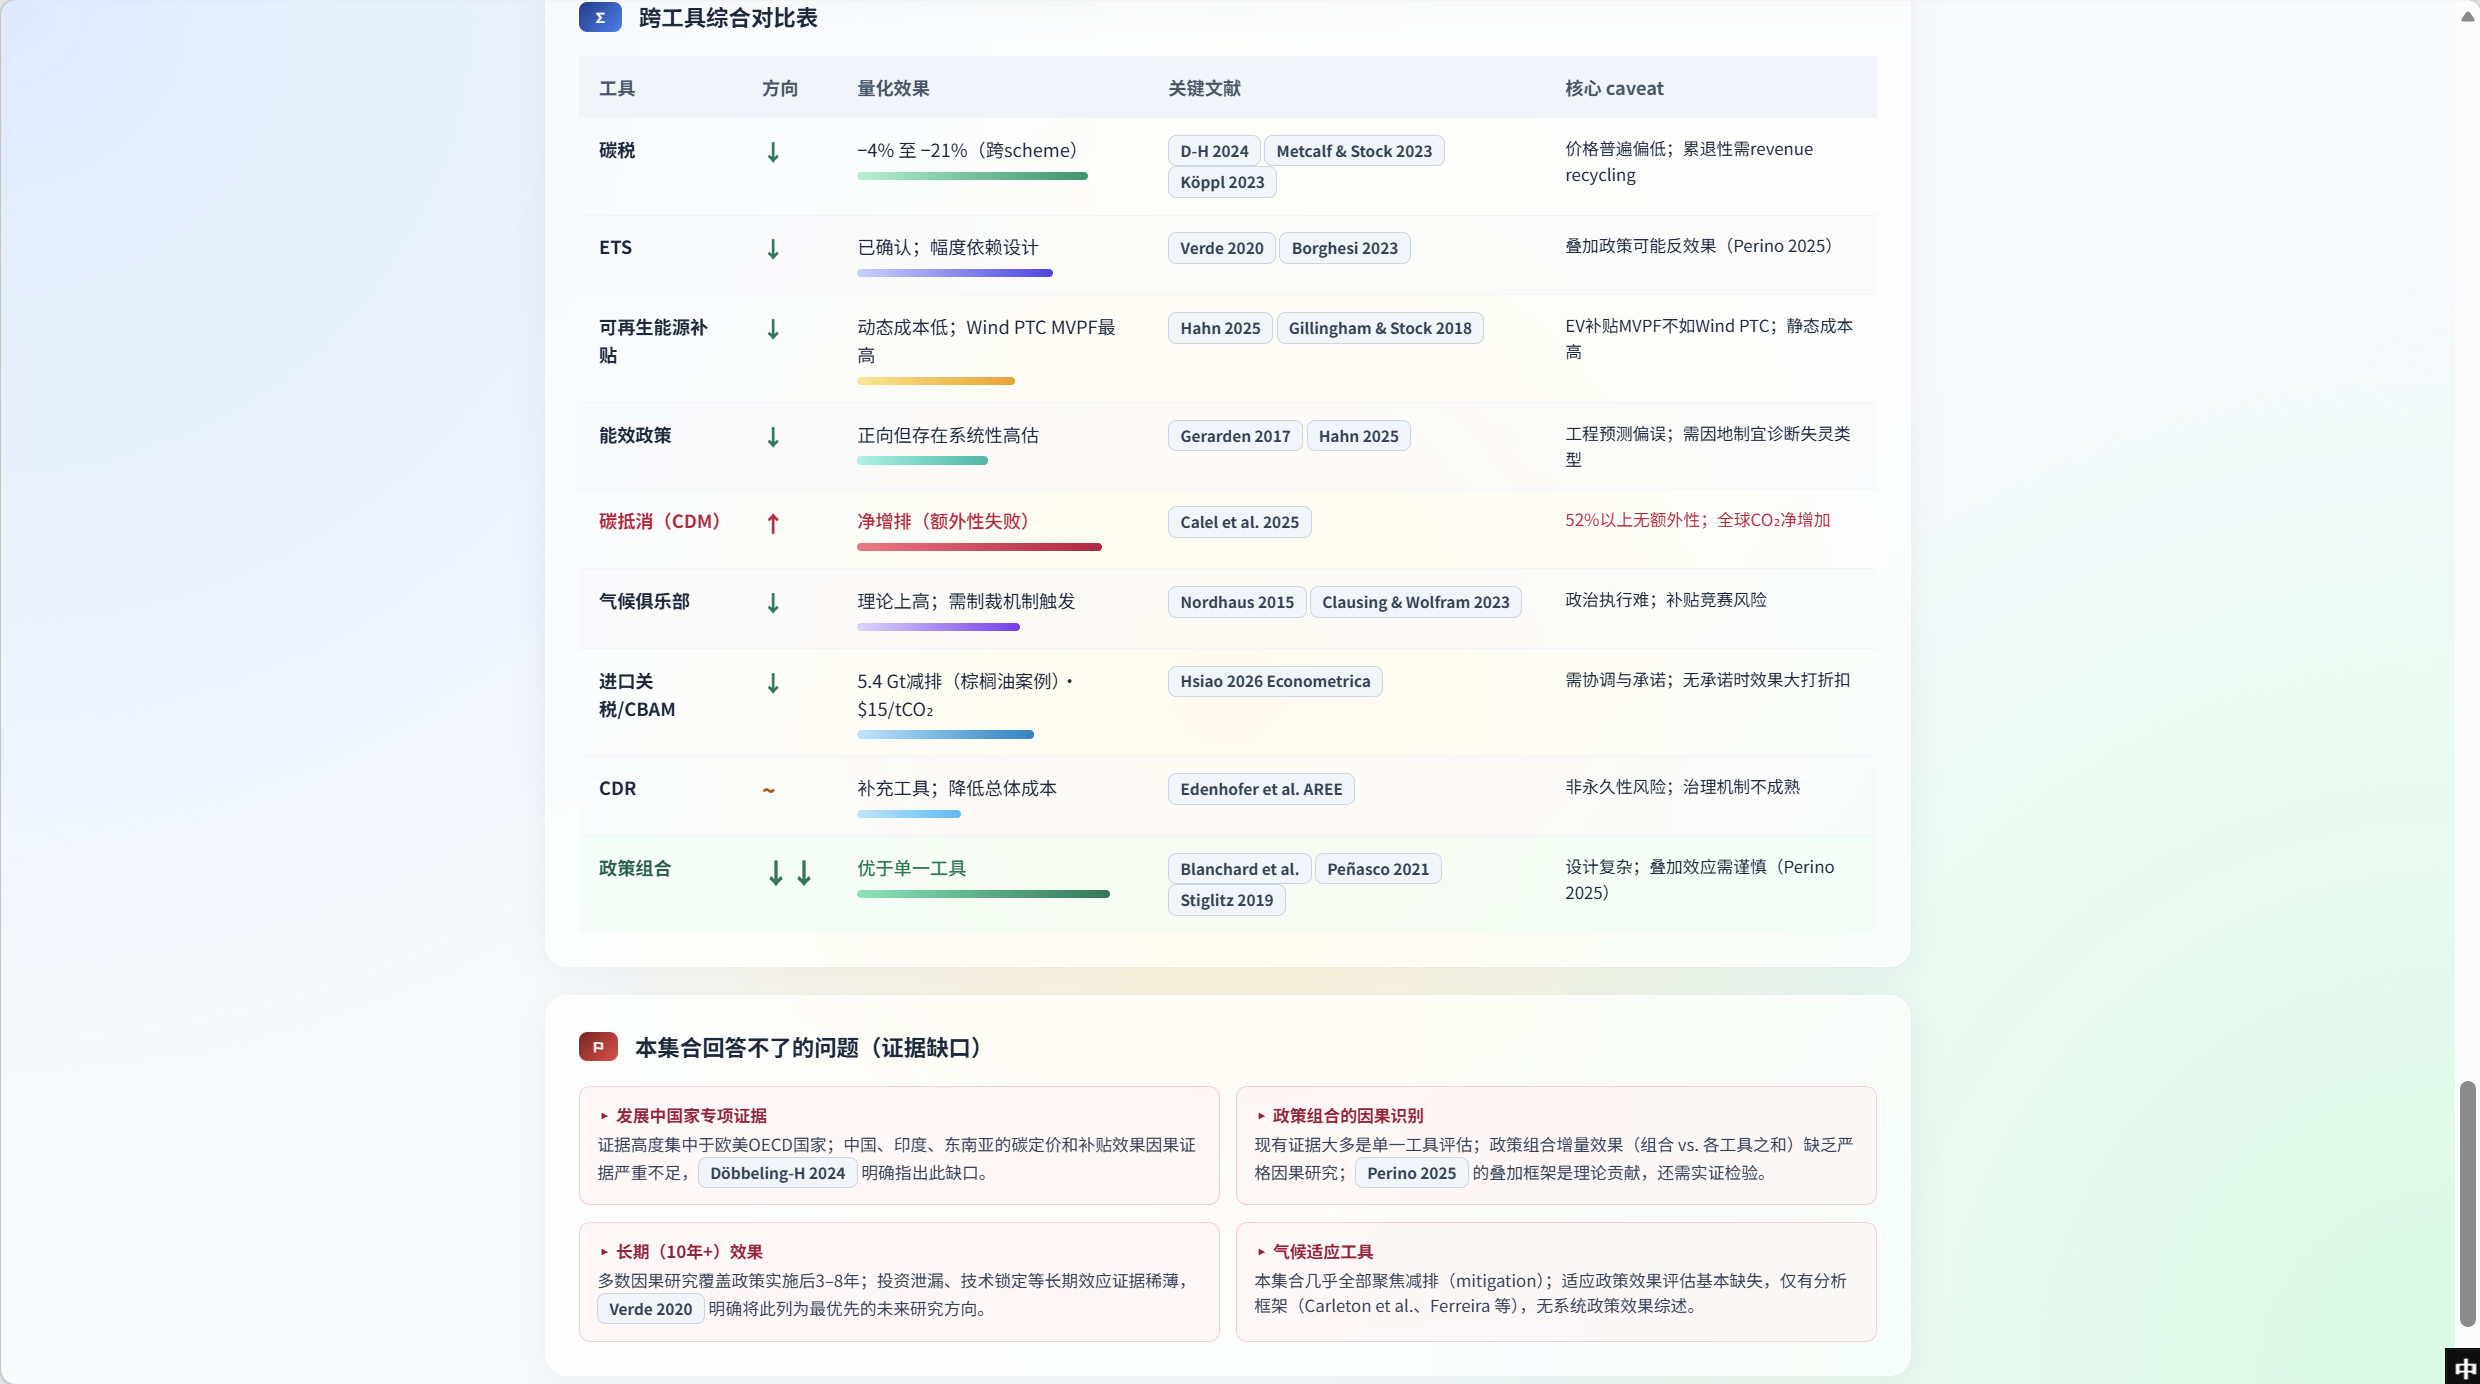
Cross-tool comparison table
After sections 02–07, the page surfaces a cross-tool comparison table — the synthesising layer of the whole answer. Every tool gets a row with direction (↓ reduction / ↑ increase / ~ neutral), quantitative range, the strongest citation set, and a core caveat — the one-line “but…” a reader would otherwise miss. The CDM row is intentionally rendered red: the corpus finds it has a failure mode (52%+ lack additionality → net CO₂ increase globally), and the system flags it visually rather than burying it in prose. The Policy-mix row at the bottom — direction ↓↓ — shows that tool mixes outperform single tools, with citations to Blanchard et al., Peñasco 2021, Stiglitz 2019.
Evidence-gaps card (page footer)
Below the comparison table, the evidence-gaps card is the meta-honesty layer — four named blind-spots, each with a citation supporting why we know we don’t know:
- Developing-country-specific evidence — corpus is OECD-heavy; China / India / SEA causal evidence is thin (Döbbeling-H 2024 names this explicitly).
- Policy-mix causal identification — most evidence is single-tool; policy-mix incremental effects and mix-vs-sum questions lack rigorous causal studies (Perino 2025 framework is theoretical, needs empirical test).
- Long-term (10y+) effects — most causal studies cover 3–8 years post-implementation; investment leakage, technology lock-in long-term effects under-studied (Verde 2020 names this as a top future-research direction).
- Climate-adaptation tools — corpus is almost entirely mitigation-focused; adaptation policy-effect evaluation is essentially absent (only frameworks like Carleton et al. / Ferreira, no systematic synthesis).
By placing these gaps directly after the comparison table, the agent makes its own coverage limits part of the answer rather than letting them surface as silent hallucinations downstream.
Filters and interactivity
- Year-range slider above the dashboard restricts the corpus (e.g. only post-2018 evidence). Effect ranges and tool coverage recompute live.
- Filter buttons: meta-analyses only, causal identification only, OECD only / non-OECD only, peer-reviewed top journals only. Each filter shows the resulting paper count before applying.
- Sortable comparison table — sortable by direction (consensus first), effect magnitude, citation count, publication year.
- Citation chips drill into the paper’s full finding page; tool-section anchors in the left margin let the user jump straight to 02 — Subsidies without scrolling.
T2 routing — when this mode fires
- Triggers on multi-tool / impact / comparison intents: “how effective is X?”, “which policy is better?”, “what X tools are available?”, “compare X and Y”.
- Fallback to T3 (qualitative comparison) when any compared tool has fewer than 3 corpus papers — the system refuses to render a comparison row it can’t statistically defend.
- Empty-row policy: tools the user explicitly asked about but for which the corpus has no evidence render as “evidence absent — see C5 coverage card” instead of being silently dropped.
Cross-paper synthesis logic
- Effect range per comparison row comes from a meta-aggregation pass: lowest and highest reported effect across all in-scope papers, weighted by sample size and reverse-weighted by inverse standard error. Single-paper rows show the raw range with a
n=1badge. - Direction consensus tag (↓ / ↑ / ~) requires ≥ 60% of papers agreeing on sign. Below 60%, the row is tagged
mixed evidenceand both directions render side-by-side. - Red highlighting is automatic — any row where the consensus direction contradicts the policy’s stated intent (e.g. a carbon-offset mechanism that increases emissions) gets a red border + red text. The user never has to spot it in prose.
- Evidence-gaps card is populated by a parallel pass that compares the actual corpus to a pre-declared list of expected concept clusters (per the platform’s taxonomy). Any cluster with fewer than 2 papers is named as a blind-spot, with a citation pointing to the paper that flagged the gap (so the gap itself is evidence-backed).
- Source quality weighting: meta-analyses count 3×; peer-reviewed top journals 2×; working papers and pre-prints 1× but tagged
pre-printon the citation chip.
T3 — Internal library metadata (“how many papers? do we have AER articles?”)
Coverage: ~10% of incoming queries. Purpose: answers questions about the library itself — “how many papers do we have?”, “do we have any AER articles?”, “how many papers on China ETS?”, etc. Not LLM-generated.
Implementation: the answer is looked up from a pre-prepared metadata sheet (library_meta_questions_v1.xlsx) maintained by the curator. The sheet enumerates the expected meta-questions and their canonical answers; the system matches the user prompt to the closest sheet row. This makes T3 deterministic and fast — and avoids the LLM hallucinating numbers about the corpus.
Functions on this page:
- Direct metadata fact card — the number / list pulled straight from the metadata sheet, with no LLM intermediary.
- Sheet-version + last-updated timestamp so the user knows how fresh the answer is.
- “Live recompute” button (admin only) — bypasses the sheet and recomputes the count from the live Neo4j store (useful when the sheet is stale).
- Drill-into-Evidence-Library jump — for list-type meta-questions (e.g. “which AER articles?”), jump to the Evidence Library filtered to that subset.
- “This question isn’t in the sheet” fallback — if no sheet row matches, T3 falls back to T4 (out-of-scope) with a hint that the meta-question should be added to the sheet.
- Same confidence + feedback strip as T1 / T2 — confidence is typically pinned at 100% since the answer is deterministic.
T4 — Out-of-scope / hard questions the system can’t answer yet
Coverage: ~20% of incoming queries. Current state: these are the questions the system can’t answer — anything that needs external knowledge not in the corpus, ephemeral facts, specific local-government queries outside the climate-policy literature, or questions about adjacent domains the library doesn’t cover. Examples from the spec:
- “What climate policies has the construction sector adopted?” — adjacent domain not covered.
- “How many papers does the library include?” — handled by T3 if the meta-question is on the sheet, otherwise T4.
- “Which climate policies has China announced?” — government policy, not literature.
- “What day is it today?” — ephemeral fact.
- “A specific climate policy not covered in any of our papers — what about it?” — out-of-corpus.
- “What’s the carbon-emission challenge for Chongqing? How to solve it? Which approach is most effective?” — multi-part, out-of-corpus, requires synthesis the corpus can’t support.
Current behaviour: the chatbox responds with a clear “I can’t answer this right now” rather than fabricating. This is the conservative-by-design refusal — a hardcoded sentinel response that explains why the question is out-of-scope. Long-term: the team hopes to drop the refusal rate as the library expands and external-knowledge tools (live web retrieval, government-policy crawlers, real-time fact lookup) come online. Not solved yet.
Functions on this page:
- Refusal sentinel card — the canonical refusal, explaining which reason fired (external knowledge required / out-of-corpus / metadata not yet prepared / adjacent domain).
- Reason classifier — sub-categorises the refusal: external-fact, local-government, out-of-domain literature, ephemeral query, unprepared-metadata.
- Closest in-corpus topic suggestion — names the nearest in-library topic the user might re-phrase to, with a “try this instead” chip that pre-fills the prompt.
- Submit-for-future-coverage button — adds the unanswered query to a triage log so the team can prioritise corpus expansion or sheet-update.
- Provisional banner — explicitly frames the section as a known limitation: external-knowledge integration is on the long-term roadmap.
Knowledge Graph visualization (/graph)
Purpose: force-directed view of the KG. Used to explore neighbourhoods around any node (Paper / Finding / Driver / Outcome / Concept).
Functions on this page:
- Force-directed canvas via
react-force-graph-2d— initial view shows a top-level overview of clusters. - Node-type filter chips — toggle Paper / Finding / Driver / Outcome / Concept visibility.
- Search bar — fuzzy match on node names; selected match centres the canvas on the node.
- Click-to-expand — clicking any node expands its 1-hop neighbours; double-click expands 2-hop.
- Hover preview — node tooltip with title, type, paper count, last-updated date.
- “View in graph” jump — every citation chip elsewhere in the platform deep-links here with the relevant node pre-selected.
- Edge-type legend — explains the relation types (cause / mechanism / contradicts / cites / aggregates).
- Zoom / pan / minimap in the corner for orientation.
- Export view as PNG / SVG for slide-deck use.
Evidence Library (/evidence)
Purpose: browseable corpus index. Two views over the same underlying records.
Functions on this page:
- View tab — switch between Paper view (one row per paper) and Finding view (one row per finding extracted from a paper).
- Filter chips — year range, journal, country, tool category, method (DiD / SC / CGE / theory / meta-analysis), publication tier (top journal / others / pre-print).
- Sort menu — relevance, citation count, publication year, recency-added-to-library.
- Search bar — full-text over title + abstract + finding text.
- Bulk-select + export selection (BibTeX / CSV / Zotero) — for taking a curated subset out of the platform.
- Per-row “view in graph” jump to the Knowledge Graph page.
- Coverage indicator at the top — restates the C5 meta-card values (how many in-corpus / blind spots).
Paper detail page (/papers/:id)
Purpose: all extracted info for a single paper.
Functions on this page:
- Metadata header — title, authors, journal, year, DOI, citation count, publication-tier badge.
- Findings list — each extracted finding as a card with the claim, evidence snippet, method tag, effect range (if quantitative).
- “View in graph” jump that opens the graph view centred on this paper’s node.
- Per-finding feedback — 👍 / 👎 on the extraction quality (used for admin re-review prioritisation).
- Cite this paper — copy BibTeX / RIS / Chicago / APA snippet.
- Open original PDF — links to the source (if the user has access) or to the open-access version.
- Related-papers strip — KG-neighbour papers (cites / cited-by / similar-method).
Finding detail page (/findings/:id)
Purpose: all metadata for a single extracted finding.
Functions on this page:
- Claim text — the structured claim the system extracted (subject + relation + object + effect).
- Evidence snippet — verbatim text from the source paper that supports the claim, with offsets so it’s auditable.
- Source paper context — paper title, section, page number where the finding sits.
- Related findings — typed relations (supports / contradicts / replicates / generalises).
- LLM-judge score — the score the auto-evaluator gave this finding for accuracy + traceability + consistency.
- Re-evaluate button (admin only) — re-runs the LLM-judge pass on this finding with a fresh prompt.
- “View in graph” jump centred on the finding’s node.
Topic / taxonomy browser (/topics)
Purpose: explore the platform’s taxonomy (the X → Y schema) as a tree rather than as cards on the home page.
Functions on this page:
- Driver tree (left column) — collapsible tree of root categories → sub-categories → leaf concepts.
- Outcome tree (right column) — same structure for outcomes.
- Per-node paper count + last-ingested date.
- Bridge view — clicking a Driver leaf + Outcome leaf shows the cross-cell evidence count (e.g. Acute Extreme Weather × Firm Entry-Exit = 4 papers).
- Taxonomy edit button (admin) — opens the curation workflow (see Admin tools).
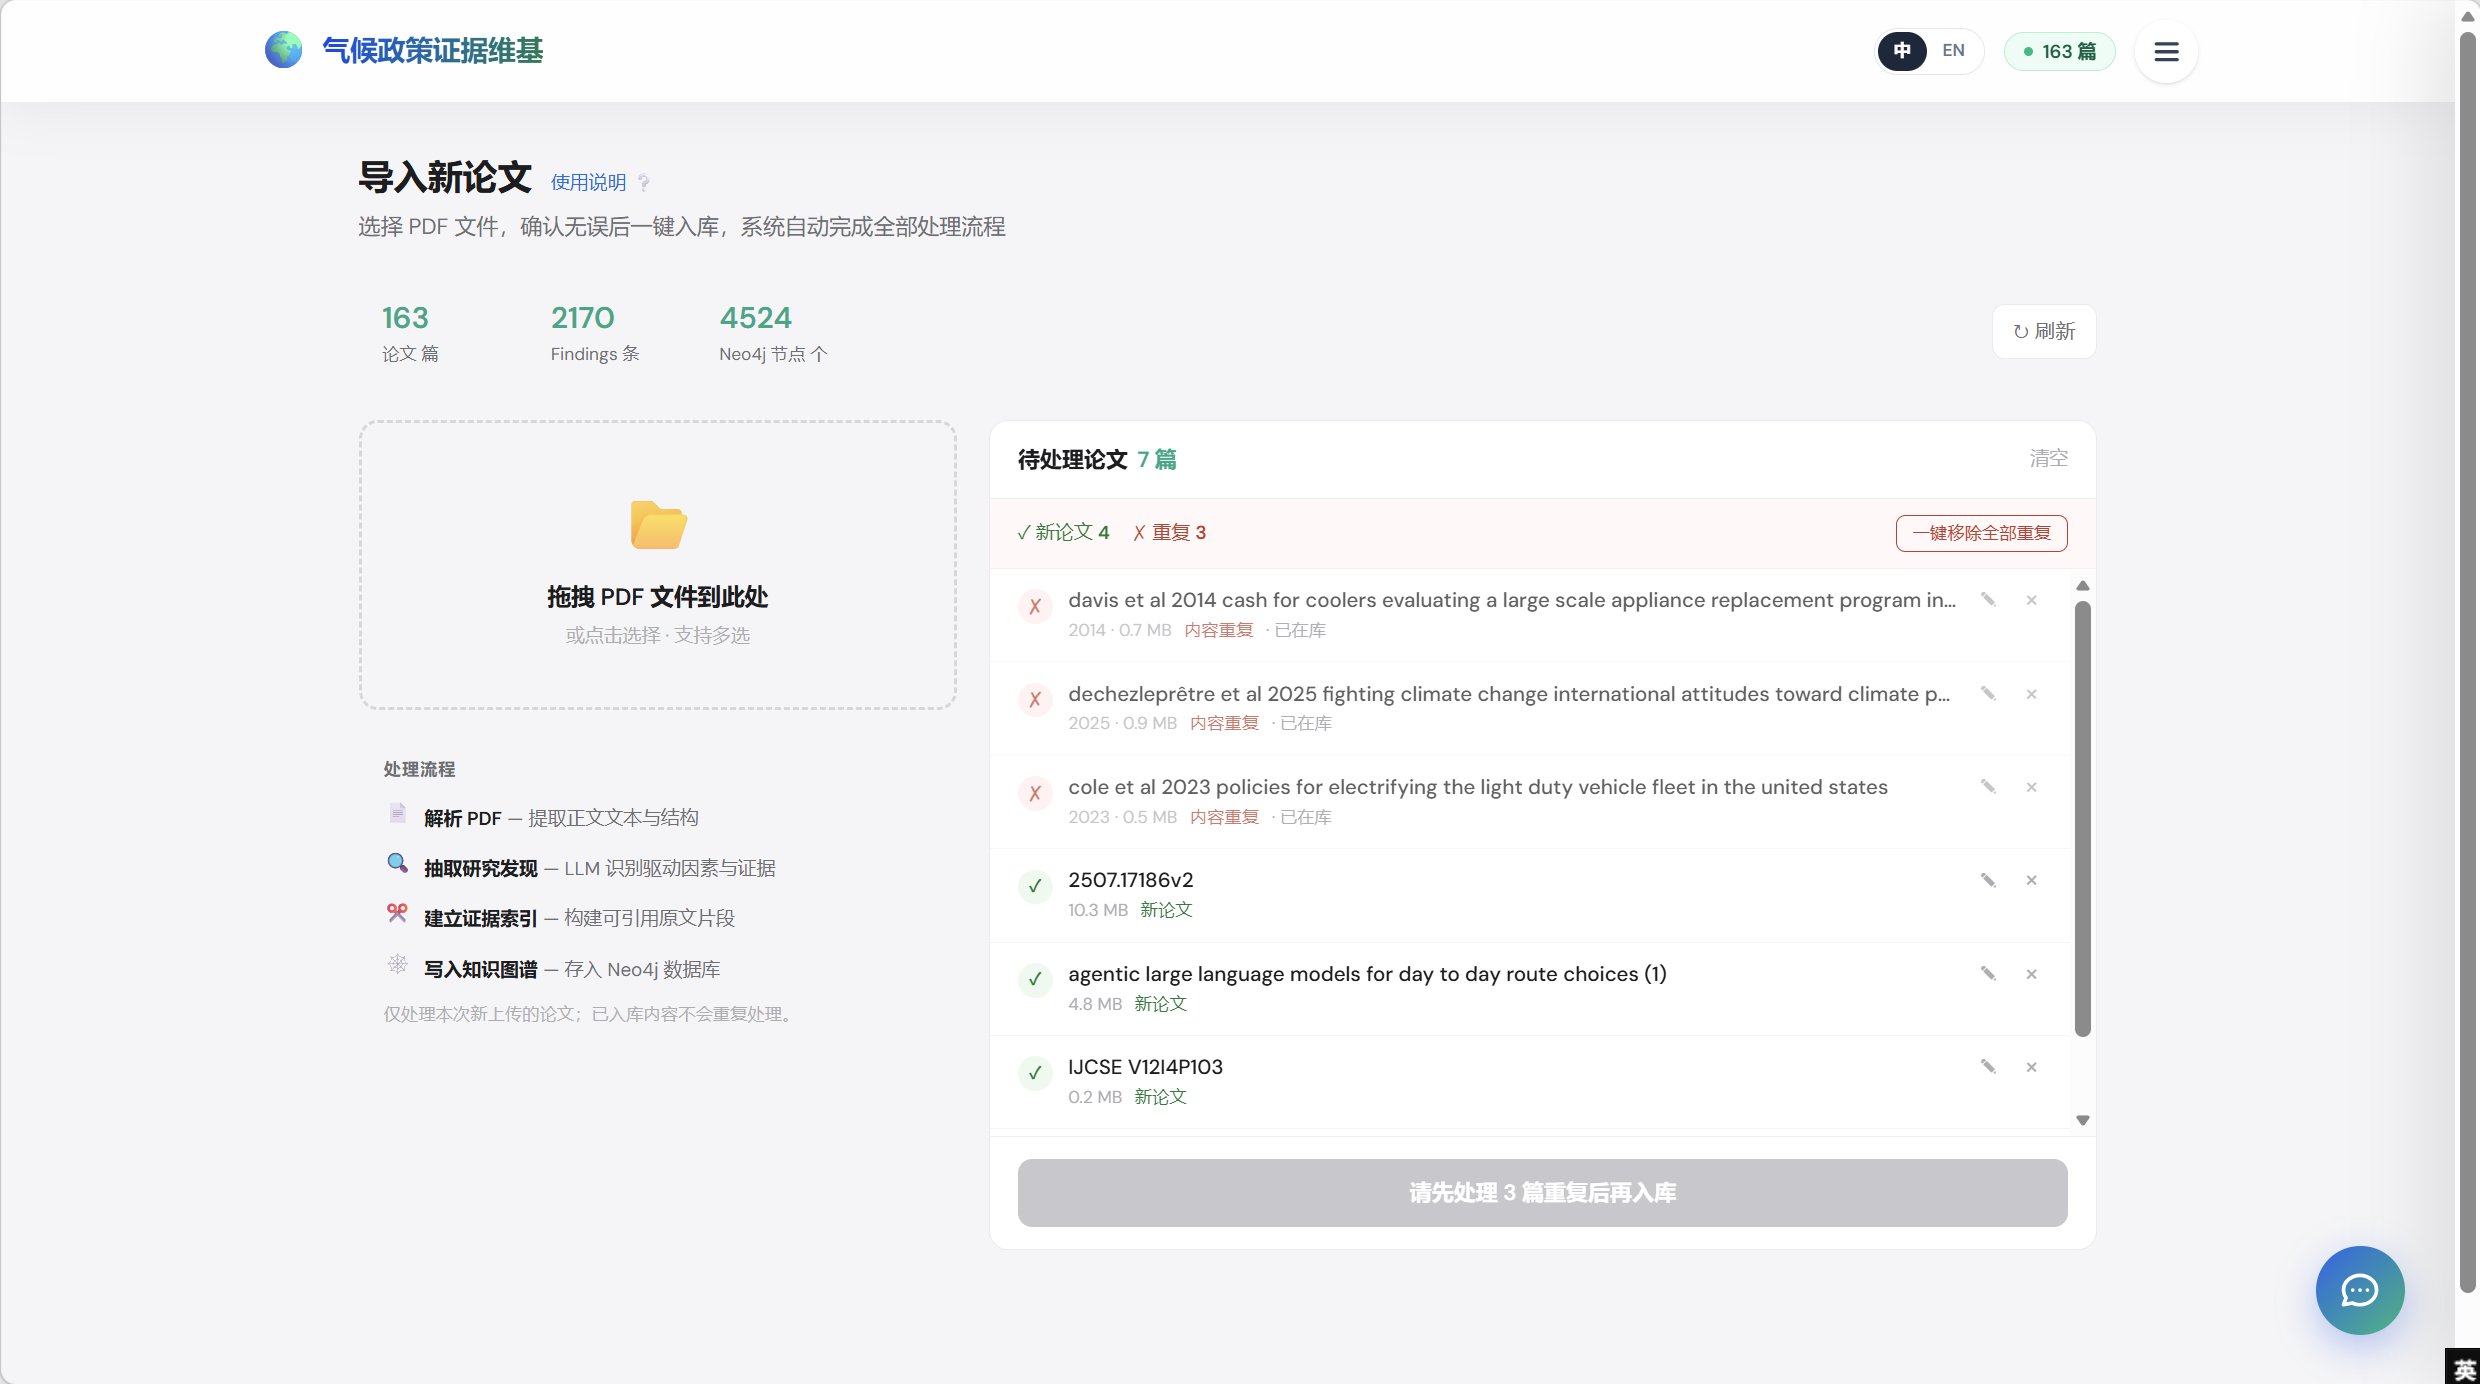
Data ingestion (/ingest)
Purpose: admin entry point for adding new papers to the library. Upload PDFs, the system extracts findings via LLM, builds an evidence index, and writes everything into Neo4j — all in one click. Duplicate detection prevents re-ingesting the same paper twice.
Functions on this page:
- Live corpus KPIs (top) — three tiles showing real-time counts pulled from Neo4j: total papers, total findings, total KG nodes (163 / 2170 / 4524 in the screenshot). A Refresh button forces a re-read.
- Drag-and-drop upload zone — accepts multiple PDFs at once; clicking opens a file picker as fallback.
- Processing-flow legend — four numbered steps the system runs on each accepted PDF: (1) parse PDF, (2) extract findings via LLM, (3) build evidence index, (4) write to Neo4j. The legend doubles as a progress UI when ingestion is running.
- Idempotency note — explicit footnote that already-in-library content is never re-processed (a deliberate user-facing guarantee about cost / time).
- Pending-papers list (right) — every uploaded file gets a row with status (✓ new / ✕ duplicate), file size, badges (new paper / content-duplicate · already in library), an edit-metadata pencil, and a remove ✕ button.
- Dedup banner — total count plus a “Remove all duplicates” one-click button; routes through a confirmation dialog before stripping them from the queue.
- Submit gate — the bottom “Ingest” CTA is disabled while any unresolved duplicates remain in the queue. The button-label tells the user exactly what to do first (“Resolve 3 duplicates before ingesting”).
- Per-row metadata editor — pencil icon opens a modal to correct title / DOI / authors before ingestion, so a flat-metadata error doesn’t require a re-upload.
Admin & curation tools (admin-only)
Purpose: post-hoc fixes to the KG that don’t require re-running the LLM ingestion pipeline. Reachable from the global menu when the signed-in user has the admin role.
Functions on this page:
- Metadata back-fill — pull missing fields (DOI, journal tier, country, year) from the source PDF or Crossref, without re-running the LLM.
- Taxonomy correction — manually re-tag a paper or finding under the right category if the auto-tag is wrong.
- Table-evidence splitting — separate a paper’s tabular findings from its prose findings (different schemas).
- Review-sheet export — generate a CSV of low-confidence findings for a human reviewer to triage offline.
- LLM-judge re-run — re-score a subset of findings with the latest judge prompt; persists the score deltas.
- User management — invite reviewers, assign roles (admin / curator / reader).
- Audit log — append-only history of every admin action, with the actor + timestamp + diff.
Feedback collection (inline on every answer)
Purpose: capture per-answer feedback to drive offline weight calibration.
Functions:
- 👍 / 👎 chip pair under every answer.
- Optional comment field that appears after the user picks a thumb.
- Snapshot persistence — feedback + the entire confidence-card state at that moment is written to SQLite (
agent/data/feedback.db). - OLS calibration job — periodic offline job re-fits the scoring-function weights against accumulated 👍/👎 labels.
- Feature-weight hot-update — admin can push updated weights without redeploying.
Settings & preferences (/settings)
Purpose: per-user preferences and account.
Functions on this page:
- Language toggle — UI language (Chinese / English) independent of the corpus language.
- Theme toggle — light / dark / system.
- Conversation retention — set the local-storage retention window (default 30 conversations).
- Citation export defaults — BibTeX vs RIS vs Chicago.
- API key management — for users using the platform’s read API directly.
- Sign-out + clear local data (forces a re-auth + wipes the conversation history).
Walkthrough screenshots of any pages still marked screenshot pending are available on request — reach out via email or LinkedIn.
Status
In progress (research-assistant role, 2026.01–present).